This post was originally created on November 11, 2016, and updated on April 20, 2024. It previously provided instructions for setting up error tracking with custom error pages, Google Tag Manager, and Universal Analytics. However, things are a bit different today with Google Analytics 4, so I’ve edited this post significantly to reflect those updates.
I was with a client browsing their website to review some new content recently, and we ran across a “500 – Internal Server Error” warning on one of the most important pages. (That means their server encountered an error that prevented it from successfully serving the page.) We were unaware of this and didn’t know how long it had been an issue.
Most websites (even big ones) do not automatically report such errors. Problems like this are usually exposed when someone (a coworker, an angry website visitor, etc.) finds and reports them. That’s terrifying if you’re responsible for an organization’s web presence. What if visitors are experiencing errors and nobody is saying anything?
One way to monitor website errors is with custom GA4 reports. In this blog post, I’ll show how most content management systems and website platforms already provide this information to GA4 in a way that allows you to report on it. If you’re not getting that data in GA4, I’ll also give you some notes about changing that.
General Approach
The easiest way to configure tracking for error pages in GA4 is to segment pages based on HTML titles (i.e., “page titles” in GA4). This assumes that your website platform fulfills all of the following conditions:
- It has custom error pages.
- The custom error pages have helpful HTML titles, including text such as “Page not found” or “Internal server error.”
- The custom error pages also include GA4 on them.
If these 3 conditions are met, it should be fairly easy to configure reports in GA4 to track your website errors. If those 3 conditions aren’t met, it’s still possible to configure tracking, but you’ll need to put in more effort to create or edit custom error pages.
Do You Have Custom Error Pages?
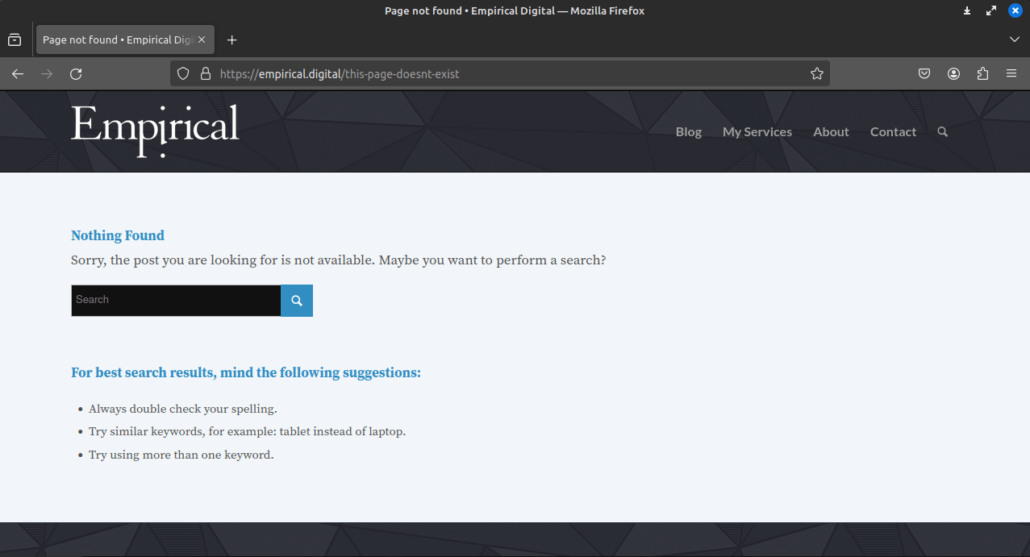
First, let’s make sure your website has custom error pages. Do your error pages look like other pages on your website? Do they use the same theme? If so, you most likely have custom error pages. For example, here’s what error pages look like on this domain:
If you don’t have custom error pages, then your error pages may look like this very plain error page from YouTube in 2016:
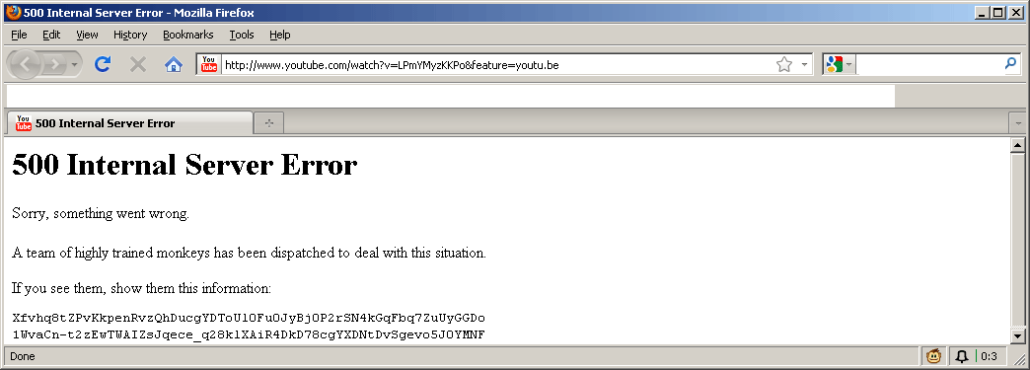
As of 2024, most website and e-commerce platforms, content management systems, and blogging systems include custom 404 error pages. Some website platforms still don’t include custom 500 error pages.
Note: if you don’t have custom error pages, consider viewing them at the bottom of this post for an overview of creating custom error pages.
Do Your Error Pages Have Helpful HTML Titles?
As of 2024, most (but not all) website platforms include helpful HTML titles (a.k.a. page titles) on custom error pages. For example, most error pages in WordPress include the text “Page not found” in the HTML title of 404 results. You can see this in the tab text for the examples I provided above.
Note: If your error pages don’t have helpful HTML titles, you’ll most likely need to work with a developer (or use a plugin or add-on) to customize them.
Do Your Error Pages Have GTM/GA4?
Your error pages must include the GA4 script to track and report errors in GA4. This seems obvious, but some website platforms or themes (e.g., Shopify, Squarespace, and Wix) don’t automatically include Analytics or GTM on error pages (even if all other pages have GA4 or GTM). If you have custom error pages with helpful HTML titles and can’t find any error pages in GA4, chances are the GA4/GTM script isn’t included on those pages.
Using Standard Reports in GA4 to View Errors
The standard, out-of-the-box reports in GA4 are notoriously useless. Still, they will give you some basic data, such as the overall number of errors encountered during a time period. To view this, do the following:
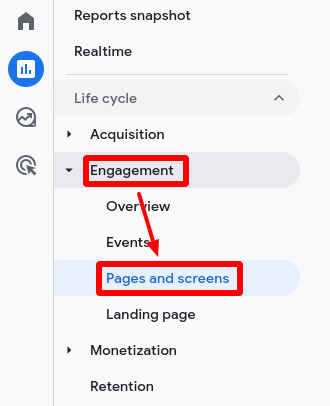
First, in GA4, view the “pages and screens” report:
Next, when viewing the “pages and screens” report, use the dropdown to select “Page title and screen class,” and then use the search field to view only pages with titles that include “Page not found” (or whatever your HTML title is for your error pages). This will show you the overall number of those errors:
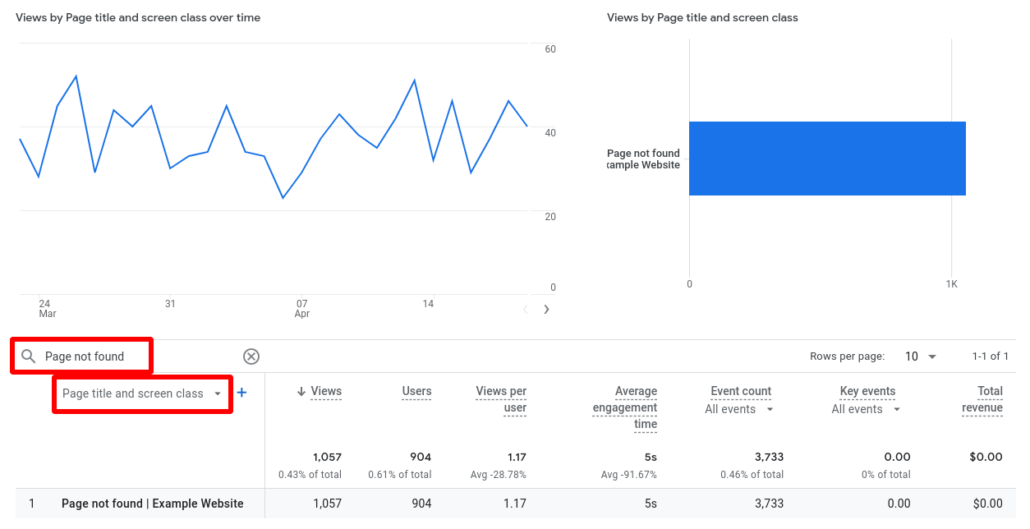
You can squeeze a little more information out of this report by clicking on the “+” next to “Page title and screen class,” typing in “page path,” and then selecting “Page path and screen class:”
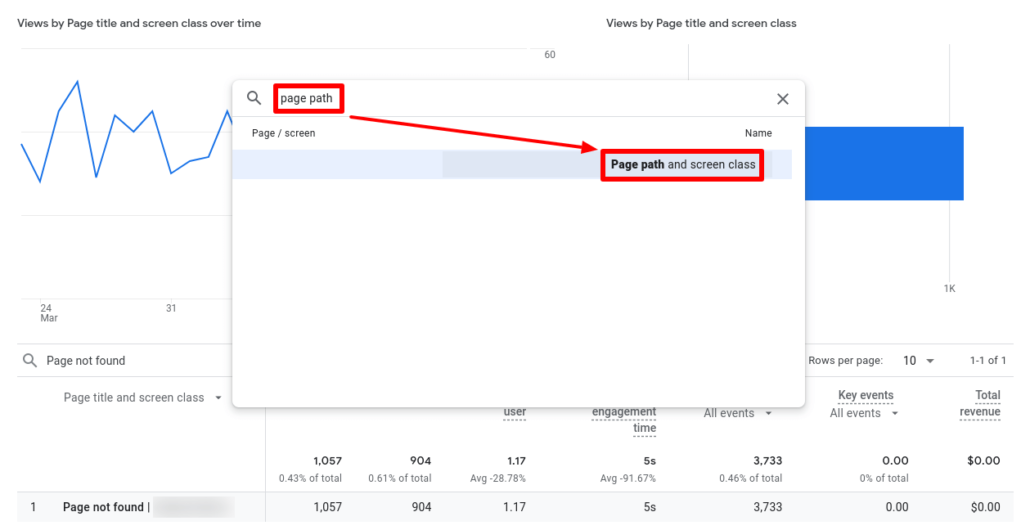
This will update the table below to include a detailed list of URLs that have resulted in errors. This is about as much information as you can squeeze out of standard reports in GA4 related to errors, and it will be sufficient for many people. If you want more details, read below to find out how to create a custom report for website errors in GA4.
Using Custom Reports in GA4 to View Errors
In this section, I’ll show you how to create a custom report with two tabs: (1) a table of 404 errors and (2) a chart showing 404 errors over time. This allows you to see precisely which page requests are generating errors, and it allows you to view how frequently those errors are happening over time. Once you create this report, you can bookmark it or access it quickly in GA4 to view this data without editing a standard report every time you log in to GA4.
How to Create a Custom Report Showing a Table of 404 Errors
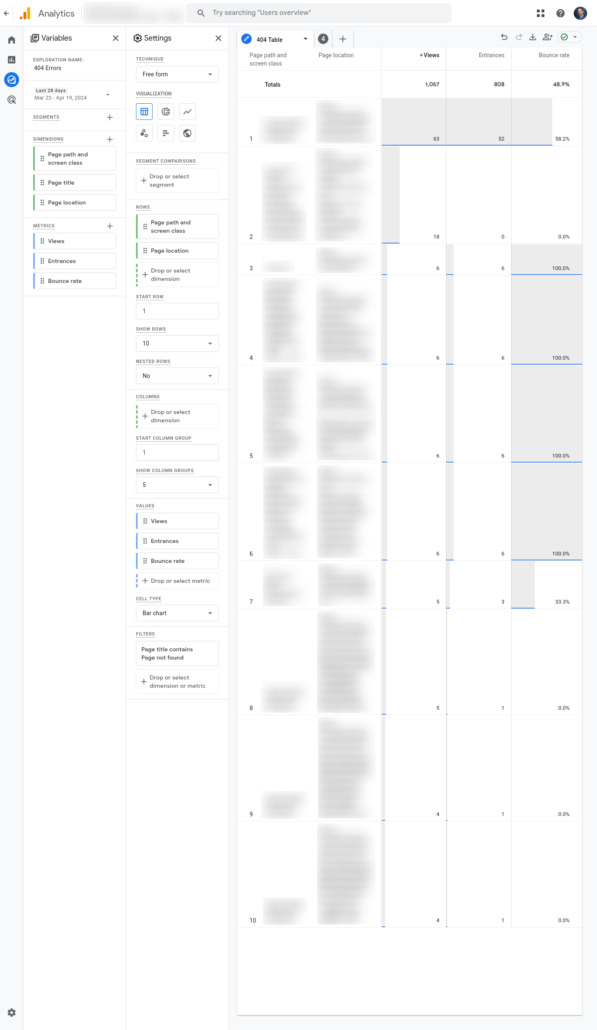
To start creating this report, go to “Explore” in the left nav of GA4 and click “Blank – Create a new exploration.” Once you’re viewing a new blank template, do the following:
- Add a name for the report under “exploration name.” Something like “404 Errors” works well.
- Add a name for this tab, such as “404 Table.”
- Add the following dimensions:
- Page path and screen class
- Page location
- Page title
- Add the following metrics:
- Views
- Entrances
- Bounce rate
- The “Technique” should say “Free form.”
- Under “Visualization,” select the “table” icon.
- Select the following rows:
- Page path and screen class
- Page location
- Note: These are different in GA4. “Page path” reports the canonical without a hostname. “Page location” reports the entire URL, including HTTP/HTTPS, hostname, page path, and any query variables. Using both of these dimensions in this report can help you identify errors caused by canonicals or query variables.
- Select the following values:
- Views
- Entrances
- Bounce rate
- Set the filter to “Page title” “contains” “Page not found” (or whatever your HTML titles say for errors).
The resulting report should look as follows (I’ve blurred some data because this is data from one of my clients):
How to Create a Custom Report Showing a Chart of 404 Errors
Creating a chart is easy once you’ve created a table. Follow these steps:
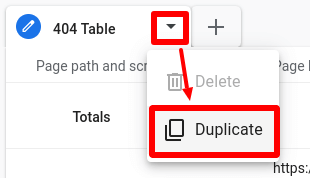
First, duplicate the tab by clicking the drop-down arrow and selecting “duplicate”:
Next, follow these steps:
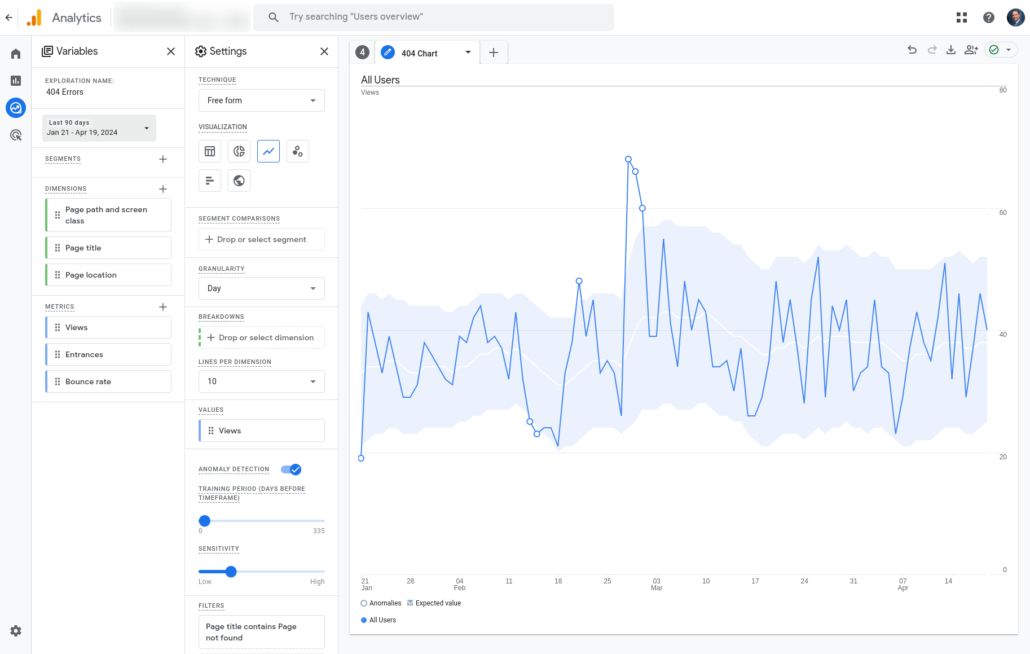
- Name the new tab “404 Chart.”
- Change the selected “Visualization” to the “Line chart” icon.
- You can keep or remove the “breakdown” dimension (as “page location” or “page path”) to view errors separately or aggregated.
The resulting report should look something like this:
Appendix: Notes About Creating Custom Error Pages
I posted images above showing the difference between standard and custom error pages. Here’s additional information about the difference and notes about creating custom error pages. This information will likely only be useful if you cannot create custom error pages using plugins or add-ons.
The problem with most standard error pages (in addition to questionable aesthetics) is that they don’t fire GTM or GA4 scripts, so they don’t send pageview data to GA4. We need to use custom error pages (with GTM or GA4 included in the HTML) to send data to Analytics. Custom error pages could be part of your CMS or static files. It’s up to you; the only requirement is that they have GTM or GA4 on them.
Custom error pages have become a best practice over time (because they provide better usability and a custom experience). Many resources are available to help you create such pages, depending on what kind of server you’re using. Agencies should provide them by default when creating websites. That said, the process for creating custom error pages on most websites is pretty simple:
- Create simple custom error pages for relevant status codes
- Make sure the page says “500 Internal Server Error” (or whatever) in the HTML title and body copy
- Make sure GTM or GA4 is included on these pages
- Configure the server to serve these pages (instead of a default message) when errors occur
If you’re running an Apache server with WordPress, configuring the server is as easy as adding the following lines to the .htaccess file:
ErrorDocument 404 /errors/notfound.html
ErrorDocument 500 /errors/internalservererror.html
ErrorDocument 501 /errors/borkedimplementation.html
Note that different website platforms and servers will require this to be done differently. That’s fine if the result is a custom error page with custom content, HTML titles and GTM/GA4. You should be able to do this for any of the many 4xx and 5xx error codes.

