
Throughout the NCAA Tournament, my brother and I captured and analyzed all tweets that contained hashtags for the 64 participating teams (e.g., Arizona: #BearDown, Florida Gulf Coast: #FGCU, Indiana: #iubb, etc.). (A full listing of the hashtags along with our methodology is provided at the bottom of this post.) In total we captured over 5 million tweets with team hashtags over 19 days. The resulting data is provided below in an elaborate collection of charts and graphs.
The Championship Game: Louisville vs. Michigan
The following is a minute-by-minute analysis of the championship game that shows how each fanbase tweeted during the game. Major spikes in tweets have a very strong correlation with significant events in the game. Interestingly, even though Louisville won the game, the highest volume of Louisville tweets followed Luke Hancock’s string of 4 3-pointers (in 2 minutes) at the end of the first half.

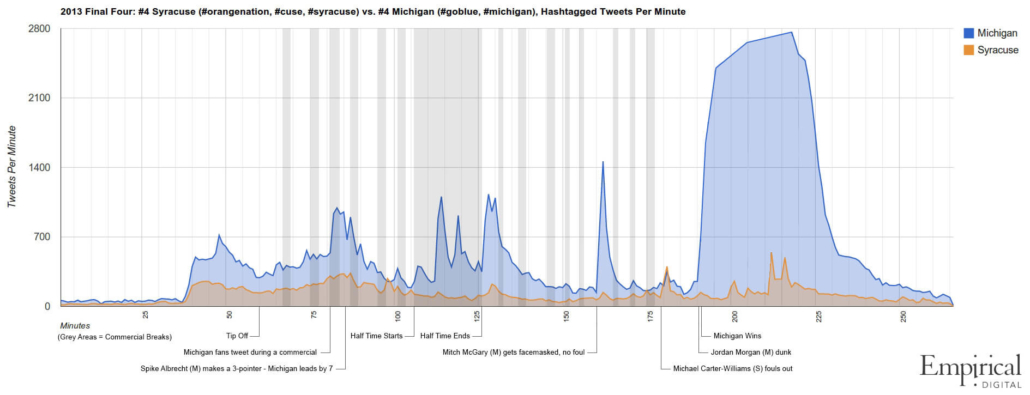
Final Four: Michigan vs. Syracuse
The following is a minute-by-minute analysis of the Final Four game between Michigan and Syracuse. The volume of tweets at the end of this game was second only to Michigan’s OT win over Kansas.
Final Four: Louisville vs. Wichita State
The following is a minute-by-minute analysis of the Final Four game between Louisville and Wichita State. This game had significantly lower volume on Twitter than the championship game and the other Final Four game between Michigan and Syracuse.

Overall Team Hashtag Use
Michigan fans sent over 600,000 tweets (#goblue), Louisville fans sent 299,403 (#l1c4 & #louisville) and Florida Gulf Coast fans sent 200,878 (#FGCU).

Hashtag Use by Athletic Conference
The Big Ten had 7 teams in the NCAA Tournament, is remarkably well organized on Twitter, and had one team (Michigan) in the championship game. The Big East had 8 teams in the NCAA Tournament, had one team in the championship game (Louisville), but doesn’t have the same level of organization on social media.

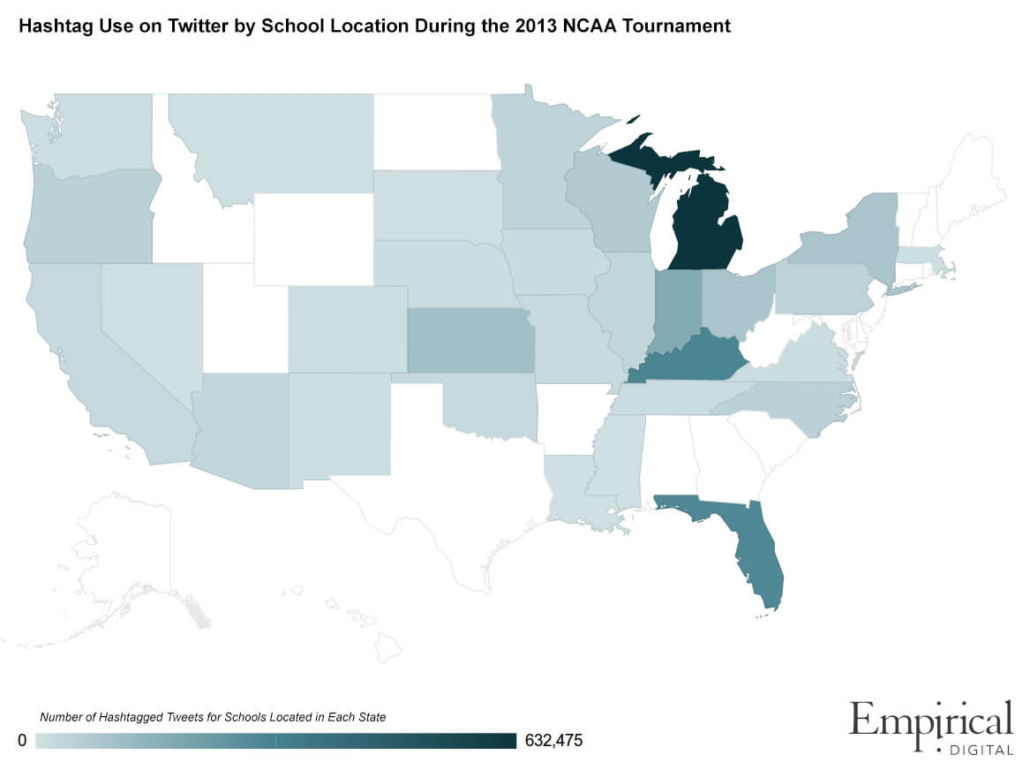
Hashtag Use by School Location
The 2013 NCAA Tournament was especially popular in states connected by Interstate 75. The University of Michigan and University of Louisville are located within an hour of I-75, and the Georgia Dome (location of the Final Four and championship game) is only about one mile from the highway.
Hashtag Use vs. Tournament Seed vs. Number of Wins
Note that the y-axis on this graph uses a log scale (if we use a standard scale then ~50 different schools are all huddled around the baseline). Regardless, the outlier is Florida Gulf Coast. They were a 15-seed — no other school with a seed greater than 4 cracked 100,000 hashtagged tweets. Additionally, the size of the bubble for each team indicates how many wins that team had in the tournament (0-6).

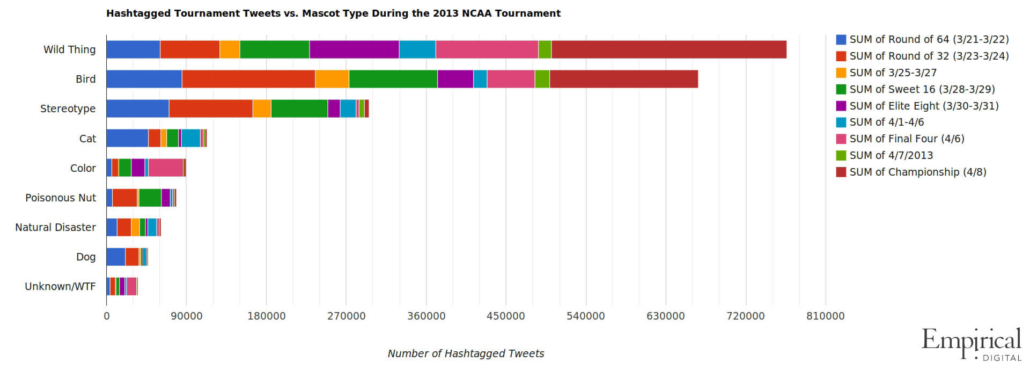
Hashtag Use by Mascot Type
The next graph shows hashtagged tweets vs. mascot type (e.g., Michigan’s wolverines = “wild thing,” Louisville’s cardinals = “bird,” etc.) Clarification may be needed for the following categories: ‘Stereotype’ includes human-like characters, such as Cowboys, Sooners, Spartans, etc. The ‘Poisonous Nut’ category exists solely because of Ohio State. The ‘Unknown/WTF’ category includes Wichita State (the “WuShock” mascot evolved over 90 years from a bundle of wheat into … an oddly personified bundle of wheat), St. Louis (even they don’t seem to know what their mascot is), and Western Kentucky (the “Hilltopper,” which is always an automatic qualifier in the ‘WTF’ category).
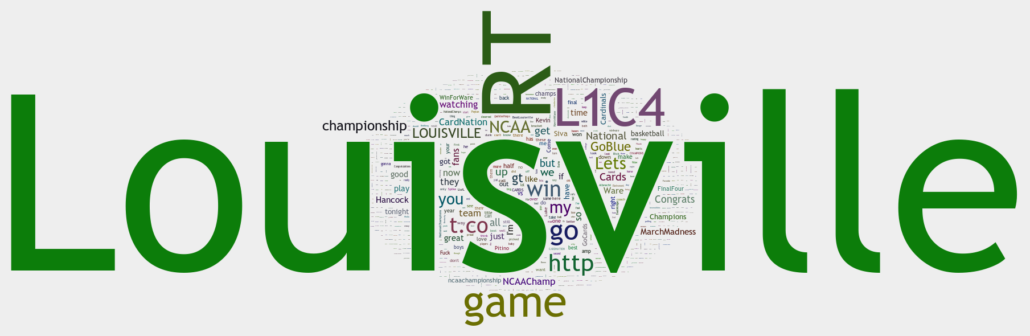
Championship: Louisville Tweets
There were 165,130 tweets hashtagged with #L1C4, #Louisville or #uofl during the championship game. This is a word cloud generated from those tweets (the most frequently used words are larger):
Championship: Michigan Tweets
There were 261,534 tweets hashtagged with #goblue or #michigan during the championship game. This is a word cloud generated from those tweets (the most frequently used words are larger):

Championship: Tweets about Refs
Both fanbases kept it classy on Twitter even though there were some questionable calls. Only 1% of Michigan tweets and 0.8% of Louisville tweets contained ‘refs.’ (Note: ‘refs’ was mentioned 28 times more than ‘referees’ or other similar terms, so we limited our analysis to ‘refs.’) Trey Burke’s foul while blocking Peyton Siva was the call that received the most attention on Twitter during the game (it was also the second highest peak in tweets for Michigan fans during the second half of the championship game — meaning that many people mentioned it without calling out the referees specifically). The following word cloud shows the most popular words used in tweets containing “refs” during the championship game (the most frequently used words are larger):

Most Retweeted Tweets During the Tournament
The following tweets received the most retweets during the tournament:
#1 (10,044 RT’s)
https://twitter.com/KingJames/status/315894684830543872
#2 (4,338 RT’s)
https://twitter.com/KingJames/status/317460608880627714
#3 (3,194 RT’s)
https://twitter.com/BigSean/status/320715720411467776
#4 (2,376 RT’s)
https://twitter.com/KateUpton/status/318431442965254146
#5 (2,325 RT’s)
https://twitter.com/AthletePride/status/316007872972611584
Analysis of the Top 3 Hashtags: Michigan, Louisville & Florida Gulf Coast
Michigan
Michigan’s athletic department is the 5th largest in college sports in terms of revenue, they have a huge marketing department that does digital marketing relatively well, and all stakeholders (the fans, the athletic department, the bloggers, and the media) use the same hashtag throughout social media channels. Examples of Michigan’s social media prowess are plenty. Their social media community is centered around the most visited football blog on the Internet, MGoBlog, which is surprisingly ugly has been around since 2004 and constantly churns out a massive stream of witty and insightful posts, and has built a huge community by doing so. Michigan’s football team has more fans than any other team on Facebook. The Wikipedia pages for “foul,” “personal foul,” “alley-oop,” “shot clock,” “layup,” and “rebounds” all use images of an early season game in which Michigan easily handled Northwestern (which is just wacky). Michigan’s Denard Robinson will be on the cover of EA Sports’ NCAA Football 2014 because he got more votes on Facebook than any other player (the contest started with players from 126 different schools). In summary, Michigan fans use social media a lot, and they’re incredibly well organized.
Louisville
The hashtag use of Louisville fans is quite a bit different, and this creates some problems for quantification and analysis. It appears that #uofl was used in the past (and is still used by some people), the athletic department seems to be pushing #l1c4 (which means, “Louisville First, Cardinals Forever” but will also be recognized by dyslexic chemists as CI4 — carbon tetraiodide), their most established blogger (CardChronicle) uses #Cards, and most of their fans seem to use #Louisville. The most frequently used hashtag during the tournament was #Louisville, which was used 4 times as much as ‘#l1c4′ during the championship game (followed by #Cards and #uofl). The most questionable hashtag is #l1c4 — nobody knows what it means and writing it on a smartphone requires constantly alternating between numbers/special characters and letters (and requires even more keystrokes if you want to capitalize the letters). It’s much easier to type any of the other choices. That said, it’s puzzling that Louisville’s athletic department would use this hashtag so frequently.
Florida Gulf Coast
Florida Gulf Coast was the Cinderella of the 2013 NCAA Tournament. What makes their story even more remarkable (in addition to beating Georgetown and San Diego St.) is that the university wasn’t established until 1991, and 2012-2013 was their basketball team’s first year as a full Division 1 member. In other words, prior to the tournament they didn’t have enough fans or alumni to account for all of the tweets that ended up shooting through the Twitterverse. They lost in the Sweet 16, but in the first 2 rounds they had more tweets than anyone. In the second round (the round of 32) they had almost twice as many hashtagged tweet as anyone (#FGCU had 89k tweets, #iubb — Indiana — had 46k). Clearly, a lot of non-affiliated fans jumped on the bandwagon. It was like a Hollywood movie, and their hashtag was easy to remember. However, it should also be noted that there can apparently only be one Cinderella per year. 15-seed Florida Gulf Coast lost in the Sweet 16, but 9-seed Wichita State continued to the Final Four and only had 31k tweets in total.
Which Hashtags We Used
Midwest: 1: Louisville (#uofl, #l1c4, #louisville), 2: Duke (#goduke), 3: Michigan St. (#spartans), 4: Saint Louis (#Billikens), 5: Oklahoma St. (#okstate), 6: Memphis (#gotigersgo), 7: Creighton (#gojays), 8: Colorado St. (#ramsmadness), 9: Missouri (#mizzou), 10: Cincinnati (#bearcats), 11: St. Mary’s (#gaels), 12: Oregon (#goducks), 13: New Mexico St. (#goaggies), 14: Valparaiso (#govalpo), 15: Albany (#gogreatdanes), 16: N.C. A&T (#ncataggies)
West: 1: Gonzaga (#gozags), 2: Ohio St. (#gobucks), 3: New Mexico (#golobos), 4: Kansas St. (#kstate), 5: Wisconsin (#badgers), 6: Arizona (#beardown), 7: Notre Dame (#notredame), 8: Pittsburgh (#hailtopitt), 9: Wichita St. (#shockernation, #watchus), 10: Iowa St. (#cyclones), 11: Belmont (#itsbruintime), 12: Ole Miss (#olemiss), 13: La Salle (#lasalle), 14: Harvard (#gocrimson), 15: Iona (#icmbb), 16: Southern (#jaguarnation)
South: 1: Kansas (#kubball), 2: Georgetown (#hoyas), 3: Florida (#gators), 4: Michigan (#goblue), 5: Virginia Commonwealth (#letsgovcu), 6: UCLA (#gobruins), 7: San Diego St. (#aztecmbb), 8: North Carolina (#uncbball), 9: Villanova (#nova), 10: Oklahoma (#sooners), 11: Minnesota (#gophers), 12: Akron (#zipsgameday), 13: South Dakota St. (#gojacks), 14: Northwestern St. (#nsula), 15: Florida Gulf Coast (#fgcu), 16: Western Kentucky (#gotops)
East: 1: Indiana (#iubb), 2: Miami (FL) (#canes), 3: Marquette (#mubb), 4: Syracuse (#orangenation, #cuse, #syracuse), 5: UNLV (#unlvmbb), 6: Butler (#butler), 7: Illinois (#illini), 8: N.C. State (#gopack), 9: Temple (#tumbb), 10: Colorado (#gobuffs), 11: Bucknell (#gobison), 12: California (#gobears), 13: Montana (#gogriz), 14: Davidson (#davidson), 15: Pacific (#gotigers), 16: James Madison (#jmudukes)
How We Did This
I’ve got access to lots of cool and expensive research tools to quantify and analyze social media conversations. We didn’t use any of those tools for this. Instead, we decided to have a little fun by creating our own scripts that hook into Twitter’s Streaming API, look for different hashtags, and dump all of the results into a text file (this is so simple that our final setup consists of one Python script that’s only 20 lines long — it hardly takes up any CPU or memory). (If you’re interested in what the raw data looked like live, here’s a video of tweets coming in at 2,800 tweets per minute during the national championship game.) Then we used more Python scripts to parse the data and Google Docs to create charts and graphs. The result is an extremely lean Twitter data gathering engine that can be customized quickly and produces data instantly. A big thanks to Jason Hill (my identical twin brother who is getting his PhD in math this year from Colorado and specializes in computational algorithms and graphs) for so much help with writing such elegant, fast code – he’ll be releasing this on his code blog for everyone to use in the near future.
If you’re interested in doing something similar, download the code from Jason’s code blog, sign up for a Twitter Streaming API key (they’re really easy to get) and hack away. Also, if you have ideas for cool projects using this technology, feel free to contact us.