
After collecting data for The Worst Super Bowl Ever, I asked a bunch of other people in Boulder, CO what sort of analysis they’d like to see. The response was overwhelming: most people wanted to know who swore more — Broncos fans or Seahawks fans? This is a reasonable way to think about things, especially for those of us currently in a state of mourning.
Discussing this further, I found an implicit assumption: most people assumed that Broncos fans were much more profane during the Super Bowl than Seattle fans, mostly because of Denver’s unconditional surrender in the first few seconds of the game. Is that assumption correct? Let’s see.
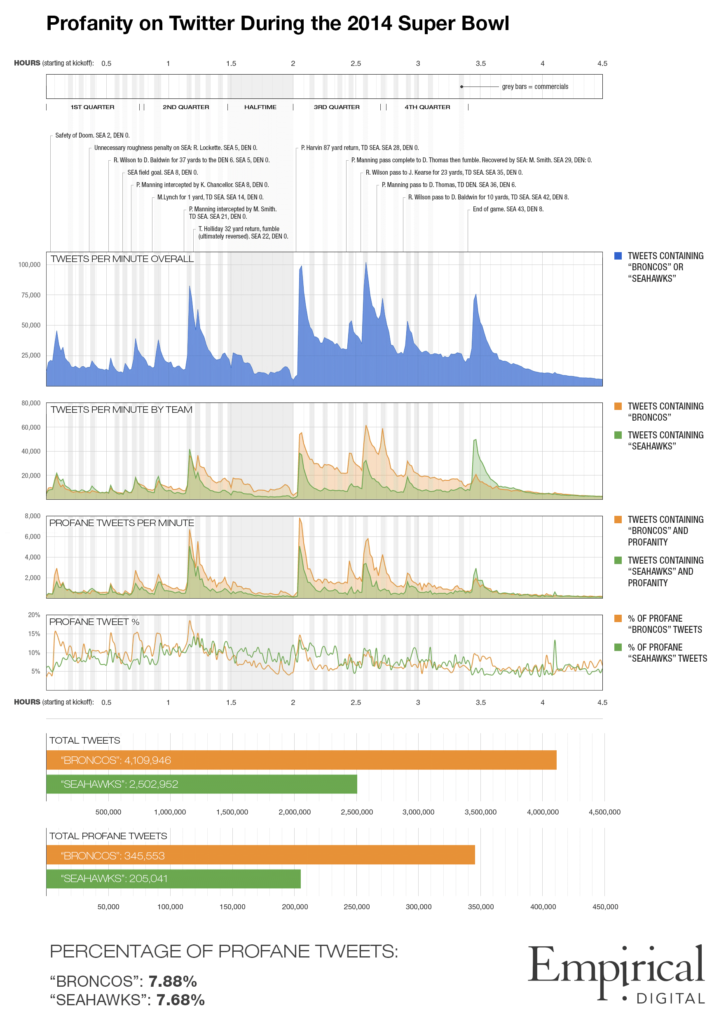
I collected and analyzed 7,175,567 tweets during the game. This includes any tweets that mentioned “Broncos” or “Seahawks” (case insensitive). The following image provides an overview of total tweets, tweets per minute (TPM), and the use of profanity during the game.
Conclusion
The most surprising conclusion is that the percentages of profane tweets for each team were almost identical: 7.88% of tweets containing “Broncos” contained profanity, whereas 7.68% of tweets containing “Seahawks” contained profanity. This means that our initial assumption — that Broncos fans would swear more — was technically wrong.
While it’s true that Broncos fans swore a lot more overall, this is only because they had more tweets overall. Both fan bases swore at an almost identical rate. This highlights the inherent difficulties of simple, term-based qualitative analysis on Twitter. In other words, just because a tweet contains the F-word (or other swear words) doesn’t mean it should be negatively scored in qualitative assessments.
Indeed, our data suggests that swear words have no statistically relevant bearing on qualitative content analysis. This makes sense because the F-word (and other swear words) generally don’t signify a stable, intrinsic meaning. They’re used more for emphasis, and in this sense act more like an exclamation mark.
Other Notable Points
- There’s an obvious correlation between big plays and spikes in activity on Twitter.
- Immediately following the conclusion of the game, profane “Seattle” tweets drop to their lowest point since tracking was initiated (even though “Seattle” tweets experience a spike overall). This is interesting psychologically because the game’s result was clear throughout the second half.
- People were likelier to use profanity in tweets in the first half, even though the second half had a greater volume of tweets. This indicates that profanity is probably more common in barn burners than blowouts. Once it becomes clear that a blowout is imminent, both fan bases are less likely to use profanity on Twitter.
Methodology
I used an open source Twitter Search API script to gather data (any tweets mentioning “Broncos” or “Seahawks”), and then some additional Python scripts to analyze the data. This provided the overall tweet per minute (TPM) volume, as well as the TPM data for each team. Then we gathered a list of 600+ swear words and cross-referenced this with each data set. Many thanks to Jason Hill, my identical twin brother and developer of the script, for all of his assistance in collecting and analyzing this data.