

Universal Analytics data is disappearing in 3 days, on July 1, 2024. The only way to access this data in the future will be if it’s been exported to another 3rd party service or CSV files. Once I started thinking about exporting Universal Analytics data, it took me only a short time to decide to use Looker Studio. It makes much more sense than manually exporting reports inside Universal Analytics, and it doesn’t cost anything. Here are some of the main benefits of this approach:
- Universal Analytics only allows you to export 5,000 rows at a time. Looker Studio doesn’t have that limitation. Using this approach, I’ve exported up to 250,000 rows of Universal Analytics data from Looker Studio.
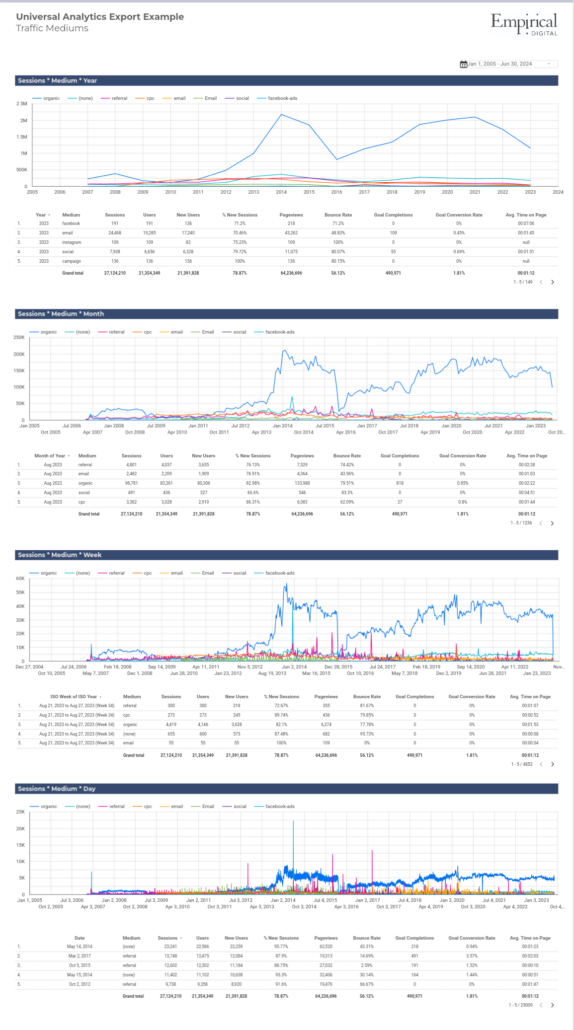
- I can create pivot tables showing one dimension (examples: traffic source/medium, page, countries) and all the daily values for the entire account history. Doing this with medium, for example, allows you to see how many organic visitors there were every day.
I’ve used this report for a few days to export a large amount of client data. Sometimes, I’ll customize it, but the core reports remain mostly the same. I’ll usually screenshot the first two pages of the report because they give a good overview of traffic mediums and sources/mediums over the history of each account:
To create a report and start exporting Universal Analytics data, do the following:
- View my example report template. I’ve used one of my old photography blogs for data.
- You can make a copy of the report by clicking on the “more options” button at the top right and then selecting “Make a Copy.”
- Looker Studio should ask you to connect a data source when creating a copy. Add a Universal Analytics data source for whichever property and view you want to export.
- Set the dates appropriately.
- Start exporting each table. You can do this in edit mode by selecting each table, then selecting the “more” button at the top right, and then selecting “export.”

I’ve included several example reports, but feel free to customize as needed.
I like this approach because it exports daily data for everything. I can use pivot tables in spreadsheets to look at specific dates, or I can summarize each data point by week, month, year, etc. It’s much more flexible than simply exporting, say, a year of data from the source/medium report in Universal Analytics.
Some quick notes:
- If your content exists on several domains or subdomains, you’ll probably want to create a calculated field that shows the hostname and page URL. Do this by following these steps:
- Select the chart on page 3.
- In the bottom-right of the “data” column select “Add a field” and then “Add calculated field.”
- Give this field a name such as “Hostname + Page.”
- Enter the following formula: CONCAT(Hostname,Page)
- Hit “Save” and then “DONE”
- Change the value of the breakdown dimension to “Hostname + Page”
- Delete the table below the chart
- Copy the chart, paste it, move it below the first chart
- Change the 2nd chart from a time series chart to a table
- Add additional metrics, such as pageviews, entrances, unique pageviews, avg time on page, bounce rate, exits, users, new users, etc.
I hope this is helpful for at least one person who procrastinated